Spatial Data Made Simple
Explore detailed visualized census data
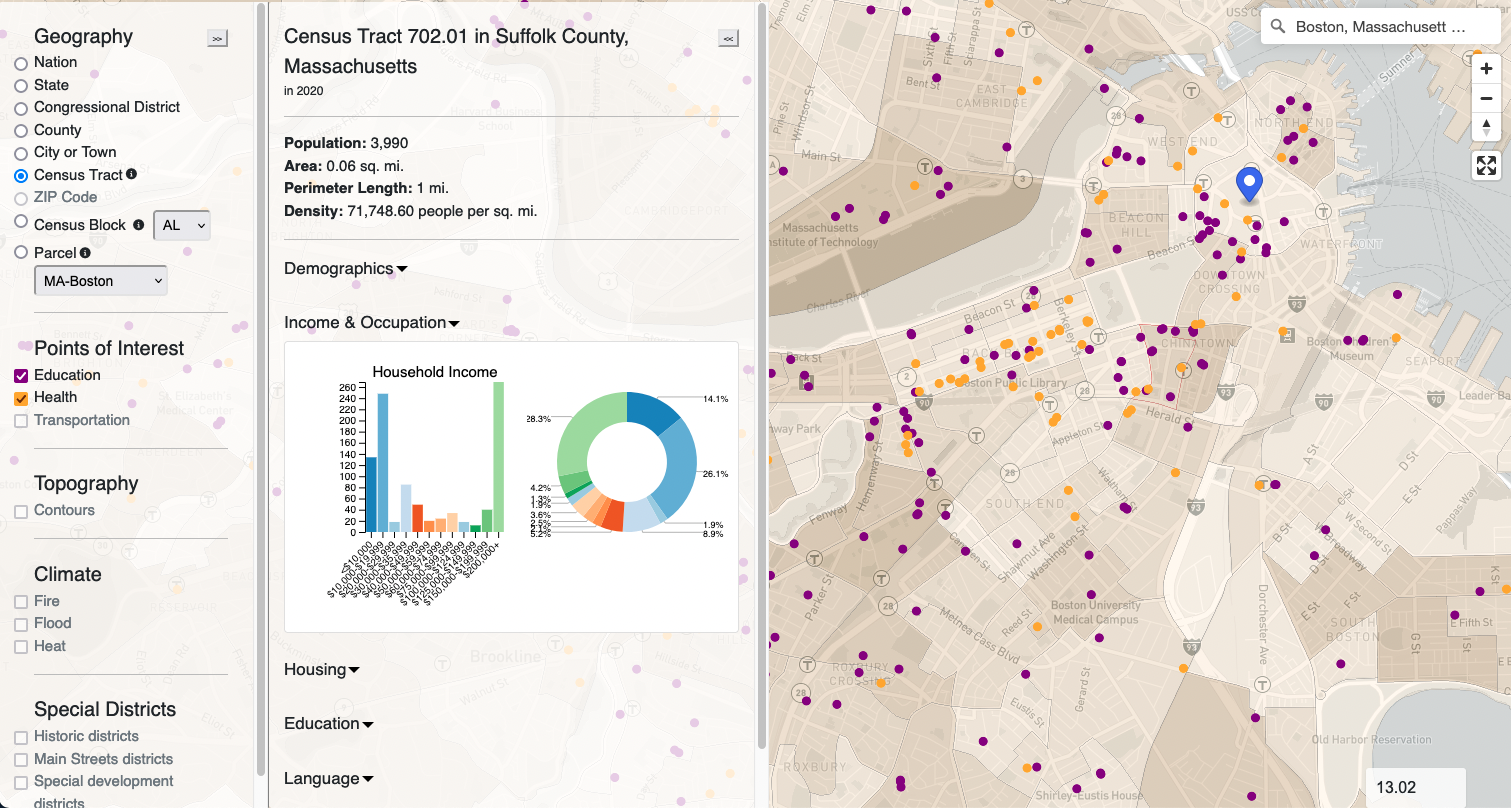
We've taken the work out of researching places and done it for you. Use barri to find actionable data on just about any place within the United States. Just select a geography (such as a state, city, country, or congressional district), zoom into the desired scale, and click to view comprehensive and detailed data fully rendered in easy-to-read charts and diagrams.
Quickly discover demographic trends, reveal hidden patterns, and compare between places.
Browse the latest spatial and demographic data.
Draw actionable insights from vivid charts and graphs.
Save maps and print reports for use offline.
Get the information you need with simple but powerful charts and diagrams that visualize data on:
and more!